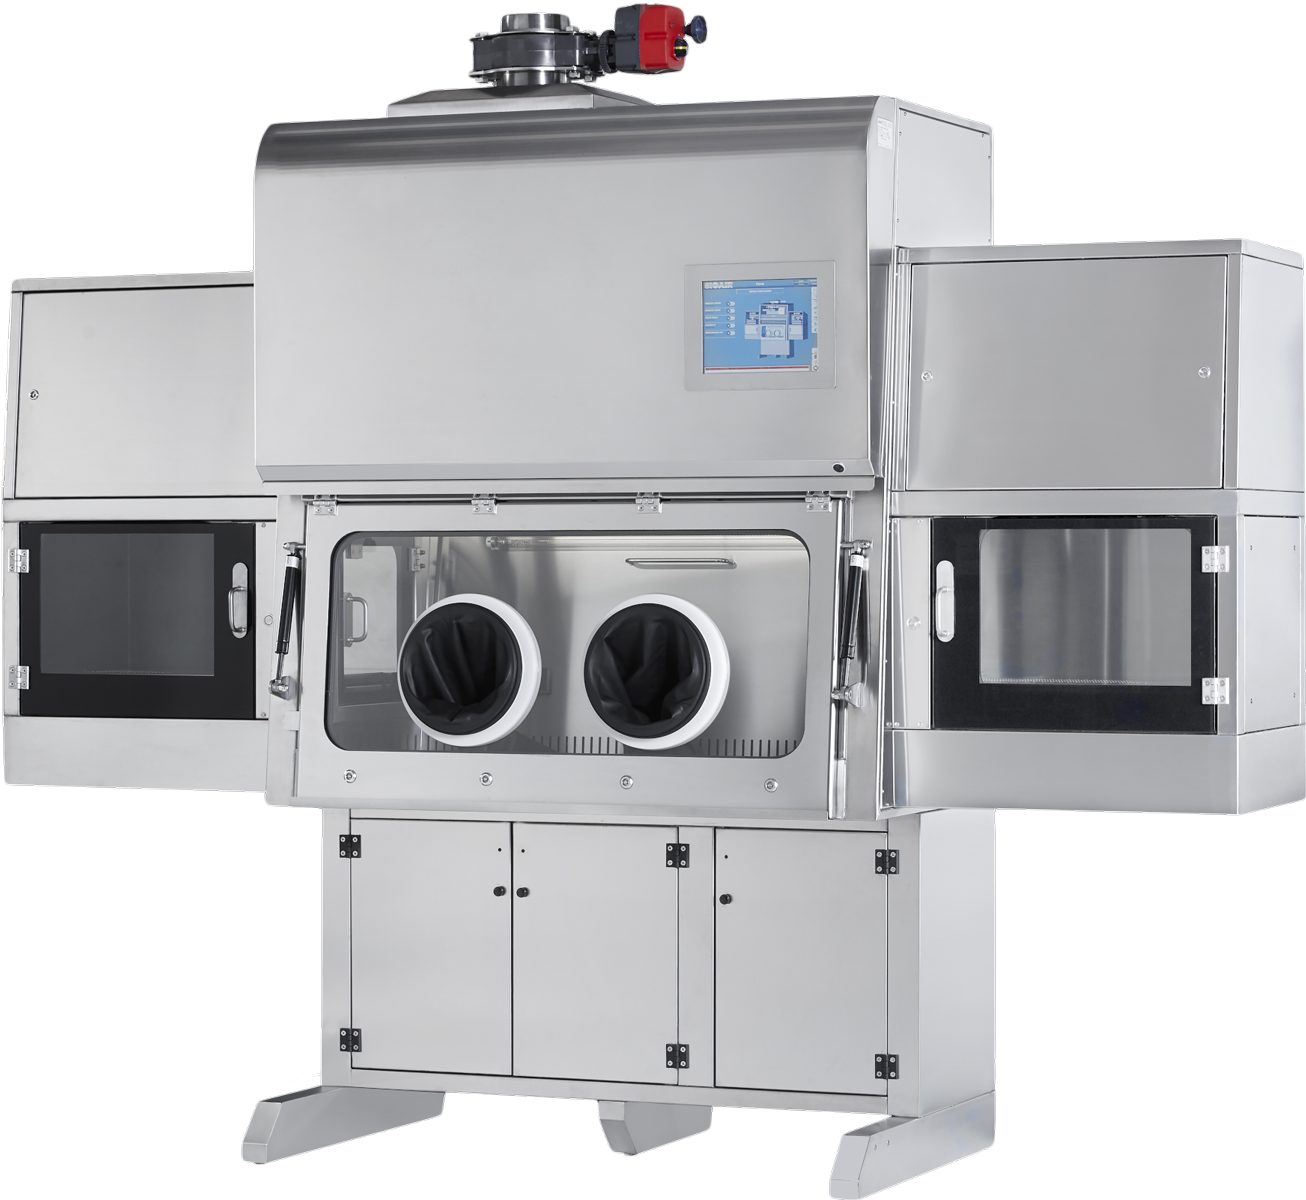
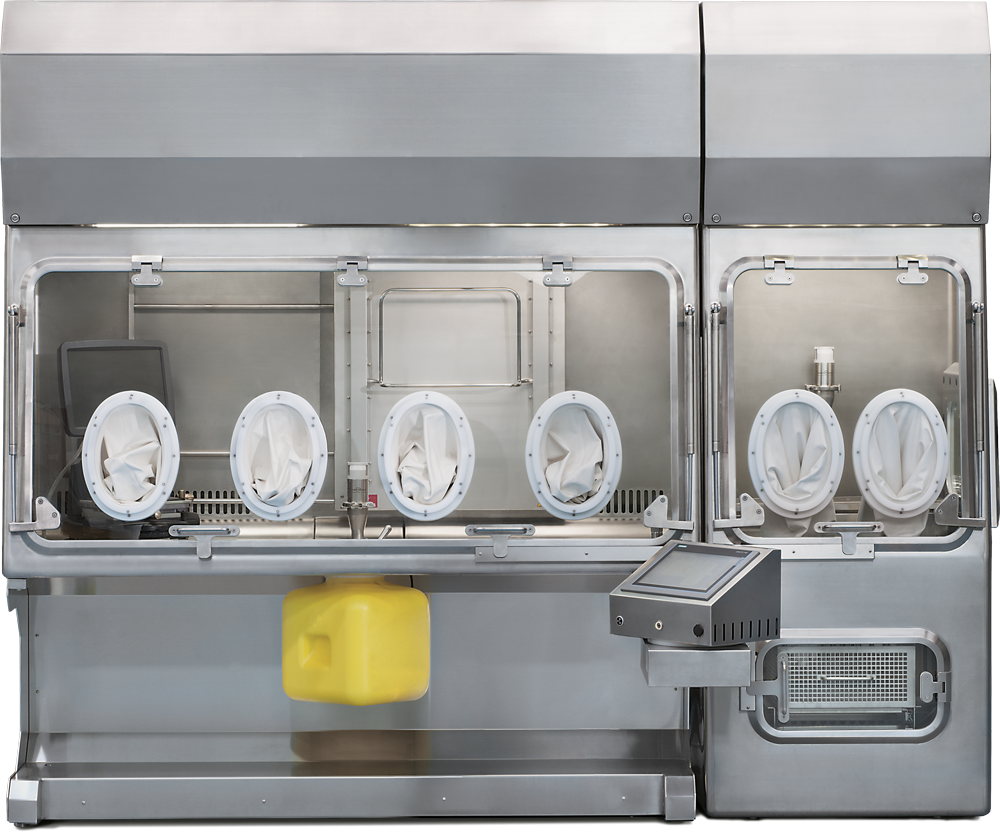
ISOCell PRO
Cell Therapy Isolator
ISOCell PRO can be the answer to your needs by providing a streamlined workflow environment reducing the set up and running costs of cell therapy products preparation.
Learn moreYour Safety is our Commitment
Posted by on 28 Apr 2020 - Last changed: 04 Jun 2020
While comparing CO2 Incubators of different brands, it is quite easy to divide the various models mainly in two braches: the ones with a fan to force air circulation and the ones taking advantage of natural convection.
Which choice is the most convenient is one of the arduous questions a customer has to face when choosing which incubator to buy.
In order to help you making a choice we present the results of our approach to the issue.
The first reason to choose to have forced air circulation inside a CO2 incubator is to help achieving and restoring temperature uniformity within the internal chamber after opening and closing the door.
While, on an intuitive level, the reasoning is sound, from a practical perspective, if the incubator heating system is properly designed, there’s no need and no advantage in having a fan moving the air.
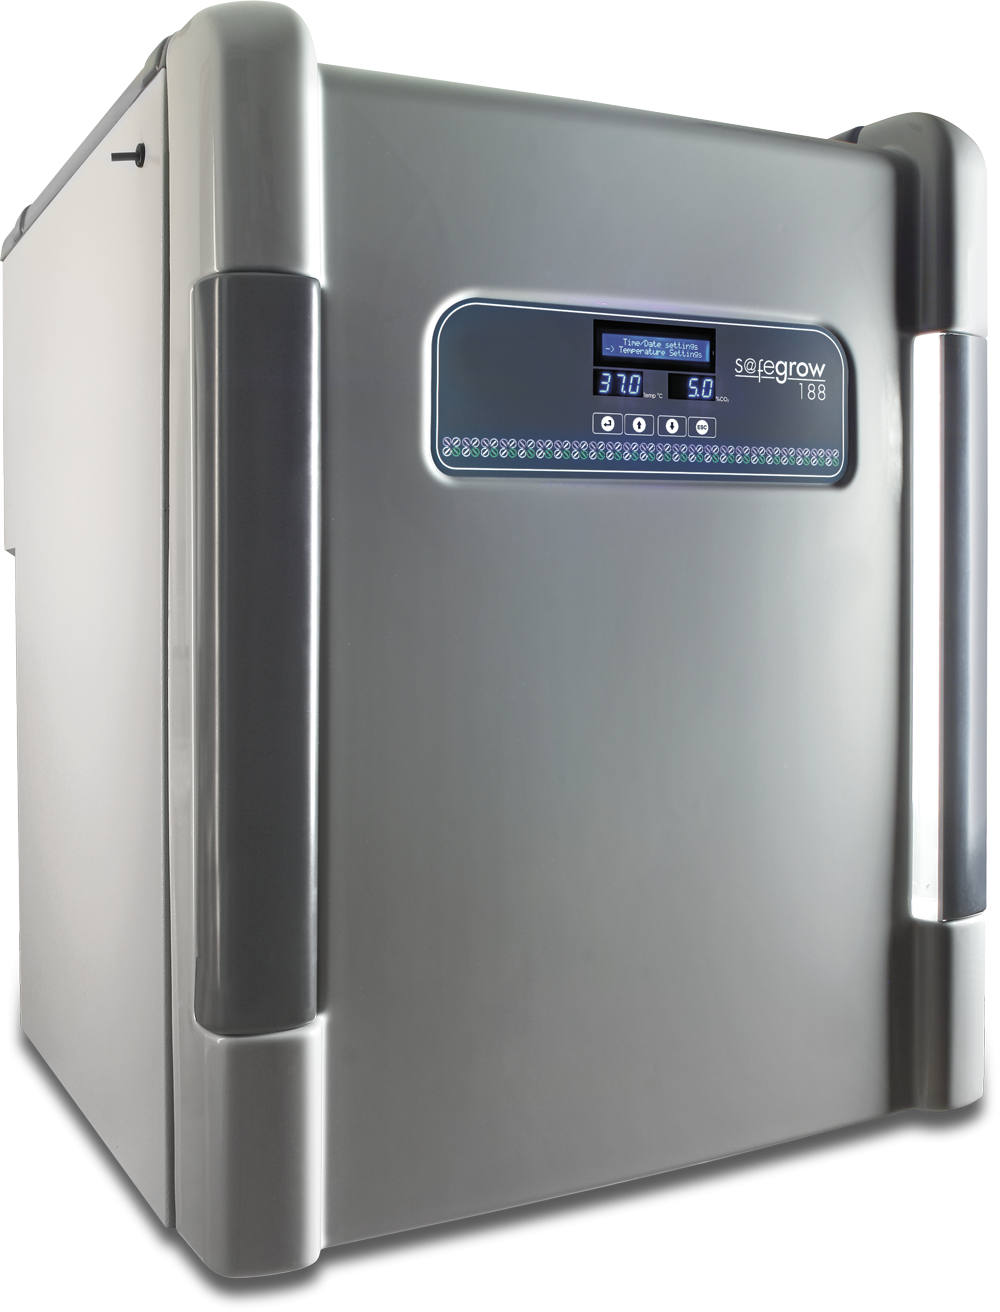
In our facilities we have run extensive temperature uniformity and recovery tests on our S@fegrow units, and the results show how, without any fan, the performance of the incubator is comparable, if not even better, than competitors.
To perform the measurements, we used National Instrument system composed of 3 CB-68T acquisition board to which 42 30K5A1IA NTC thermistors are connected. The thermistors’ ohmic value decreases when temperature increases.
Data points were collected using Labview software. All thermistors were collected simultaneously every 30 seconds.
The shelves were numbered from 1 (bottom) to 4 (top) and for each of them we put 9 sensors evenly distributed in a square matrix.
Before running the test, the incubator was allowed to reach equilibrium at the set point temperature of 37.0°C for a few hours.
The external room temperature was kept constant at 21°C.
We used a double door incubator, and each opening lasted for 15” after the inner door was opened.
Test results are summarised in Fig. 1. For each shelf the average of the nine measurement-points has been taken. Standard deviation and temperature uniformity for each shelf at set point is shown in table 1.
During the opening phase uniformity within the shelf is reduced, though no significative pattern has been detected.
As shown in graph all the shelves are within 0.3°C of the set point in about 5 minutes and within 0.2°C, thus exceeding expected performance of the incubator, in 6 minutes.
The different behaviour of shelf 1 (lowest), with a slower drop and faster recovery, shows the effects of the differential management of the heating elements of the incubator: at door opening all the elements are turned off with the exception of the base element; this avoids the formation of condensation and creates a thermal gradient in the incubation chamber that, as soon as the door is closed, drives a convective air-motion to improve uniformity recovery time.
Another detail to account for when evaluating thermal uniformity in an incubator is the surface of the shelves where the culture vessels are placed.
Many manufacturers typically provide shelves with holes in the surface in order to improve air circulation, whether forced or due to convection; whether this is beneficial or not to the circulation itself, the main issue is that in doing so a non-uniform surface is created extremely close to the cells themselves.
Air conducts heat in a very different way with respect to the steel or copper alloy of the shelves, and this creates cold spots where the holes are located.
It has been demonstrated that several cell lines are indeed affected by this temperature difference, however small it is (usually <0.5°C), showing preferential growth in the cold areas (fig.2), or away from them (fig.3).
This is a direct effect on the growth patterns of the cells, that might have influence on experimental results.
Another claim supporters of the active circulation approach usually boost as an advantage, is the presence of an HEPA filter in the system.
While it is true that, eventually, the air forced by the fan through the filter, will be cleaned by contaminants, it is also true that an incubator is not, and isn’t required to be, a sterile environment.
What’s most important is: why should we need an HEPA filter in a CO2 incubator?
The answer is: to avoid the fan from spreading contaminants. In a CO2 incubator most of the contaminations are due to moulds growing in or near the water pan, taking advantage of the extremely humid environment. If left on their own, those contaminations won’t spread very far from that area, making keeping the incubator clean very easy by regularly changing the water.
Also, the fan assembly creates an area difficult to keep clean: while most passive air circulation incubators sport seamless internal chambers, very easy to clean, the fan area and the air ducting is necessarily difficult, if not at all impossible in some places, to properly clean.
That is also the main reason why incubators with forced air circulation use an HEPA filter: it is not an advantage but a necessity to avoid the fan assembly to become a source of contamination.
The Safegrow incubators show a uniformity recovery time aligned with all the major competitors even without using any kind of forced air circulation.
We think that our technical solutions provide several advantages:
We therefore consider our approach to uniformity recovery to be extremely functional and convenient, making things easier for the end-user by taking full advantage of the state-of-the-art direct heating system equipped on our incubators.

Graph of temperature recovery. Each line represents the average of the 9 sensors for each shelf. The green dotted line represents the declared uniformity of +/-0.3°C from set-point, the red dotted lines are at +/-0.2°C from set-point. Door is opened at T0 and closed at T+15 seconds. All shelves are at or above the green line at T+5 minutes.

Cells showing preferential growth in warmer areas, with reduced density corresponding to the position of holes in the incubator’s shelf surface;

|
Shelf 1 |
||
|---|---|---|
|
Temp |
St.Dev. |
Time |
|
37,1 |
0,0 |
-00:02 |
|
37,1 |
0,0 |
-00:01 |
|
37,1 |
0,0 |
00:00:00 |
|
35,0 |
0,3 |
00:00:30 |
|
35,9 |
0,2 |
00:01:00 |
|
36,6 |
0,1 |
00:01:30 |
|
36,8 |
0,1 |
00:02:00 |
|
36,8 |
0,1 |
00:02:30 |
|
36,9 |
0,0 |
00:03:00 |
|
36,9 |
0,0 |
00:03:30 |
|
37,0 |
0,0 |
00:04:00 |
|
37,0 |
0,0 |
00:04:30 |
|
37,0 |
0,0 |
00:05:00 |
|
37,0 |
0,0 |
00:05:30 |
|
37,0 |
0,0 |
00:06:00 |
|
37,0 |
0,0 |
00:06:30 |
|
37,0 |
0,0 |
00:07:00 |
|
37,0 |
0,0 |
00:07:30 |
|
Shelf 2 |
||
|---|---|---|
|
Temp |
St.Dev. |
Time |
|
36,9 |
0,0 |
-00:02 |
|
36,9 |
0,0 |
-00:01 |
|
36,9 |
0,0 |
00:00:00 |
|
33,7 |
0,9 |
00:00:30 |
|
35,2 |
0,4 |
00:01:00 |
|
35,9 |
0,2 |
00:01:30 |
|
36,2 |
0,1 |
00:02:00 |
|
36,5 |
0,1 |
00:02:30 |
|
36,6 |
0,1 |
00:03:00 |
|
36,6 |
0,1 |
00:03:30 |
|
36,7 |
0,1 |
00:04:00 |
|
36,7 |
0,1 |
00:04:30 |
|
36,7 |
0,1 |
00:05:00 |
|
36,7 |
0,1 |
00:05:30 |
|
36,7 |
0,1 |
00:06:00 |
|
36,8 |
0,1 |
00:06:30 |
|
36,8 |
0,1 |
00:07:00 |
|
36,8 |
0,1 |
00:07:30 |
|
Shelf 3 |
||
|---|---|---|
|
Temp |
St.Dev. |
Time |
|
37,1 |
0,0 |
-00:02 |
|
37,1 |
0,0 |
-00:01 |
|
37,1 |
0,0 |
00:00:00 |
|
33,5 |
0,7 |
00:00:30 |
|
34,5 |
0,3 |
00:01:00 |
|
36,3 |
0,1 |
00:01:30 |
|
36,5 |
0,1 |
00:02:00 |
|
36,7 |
0,0 |
00:02:30 |
|
36,7 |
0,0 |
00:03:00 |
|
36,8 |
0,0 |
00:03:30 |
|
36,8 |
0,0 |
00:04:00 |
|
36,8 |
0,0 |
00:04:30 |
|
36,8 |
0,0 |
00:05:00 |
|
36,8 |
0,0 |
00:05:30 |
|
36,8 |
0,0 |
00:06:00 |
|
36,8 |
0,0 |
00:06:30 |
|
36,8 |
0,0 |
00:07:00 |
|
36,8 |
0,0 |
00:07:30 |
|
Shelf 4 |
||
|---|---|---|
|
Temp |
St.Dev. |
Time |
|
37,0 |
0,0 |
-00:02 |
|
37,0 |
0,0 |
-00:01 |
|
37,0 |
0,1 |
00:00:00 |
|
33,5 |
0,7 |
00:00:30 |
|
30,9 |
1,5 |
00:01:00 |
|
33,3 |
0,4 |
00:01:30 |
|
34,9 |
0,2 |
00:02:00 |
|
36,0 |
0,2 |
00:02:30 |
|
36,2 |
0,1 |
00:03:00 |
|
36,4 |
0,1 |
00:03:30 |
|
36,5 |
0,1 |
00:04:00 |
|
36,7 |
0,1 |
00:04:30 |
|
36,8 |
0,1 |
00:05:00 |
|
36,8 |
0,1 |
00:05:30 |
|
36,8 |
0,1 |
00:06:00 |
|
36,8 |
0,1 |
00:06:30 |
|
36,8 |
0,1 |
00:07:00 |
|
36,8 |
0,1 |
00:07:30 |

Tecniplast S.p.A.
Siziano Plant: Via Lombardia 12 – 27010 Siziano (PV) Italy - Phone: +39 0382 66721
e-mail: info@tecnilabo.com - PEC: info@pec.bioair.it - Privacy - DURC - HR WorkFlow
Politica per la qualitá - Change cookies
Tecniplast S.p.A. - Partita IVA e CF: 00211030127 - REA: 49171